With the introduction of the INFO functions in DAX and the new DAX query view in Power BI Desktop, a new approach to structured exploration and documentation of the semantic model has been made available. Detailed information about measures, columns, relationships, and other model elements can now be retrieved directly through a DAX query. In this article, the purpose, syntax, and main applications of these functions are reviewed to enhance data model analysis and transparency.
Through a practical example using INFO.MEASURES and INFO.TABLES, it will be shown how these functions can be combined and leveraged to gain clearer insights into your model structure.
Let’s look at INFO.MEASURES and demonstrate how they can be joined to other INFO functions in the DAX query view.
In Power BI Desktop, DAX access query view, and type the following EVALUATE statement followed by INFO to see all the available statements, listed.
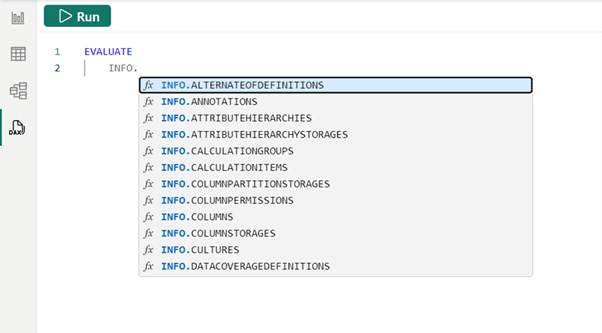
It is possible to continue typing or scroll down to INFO.MEASURES. The query can then be run by clicking “run,” or using the popular keyboard shortcut F5 (also added in December!). Additionally, the lesser-known keyboard shortcut, CTRL+SHIFT+E, can be used to run the DAX query.
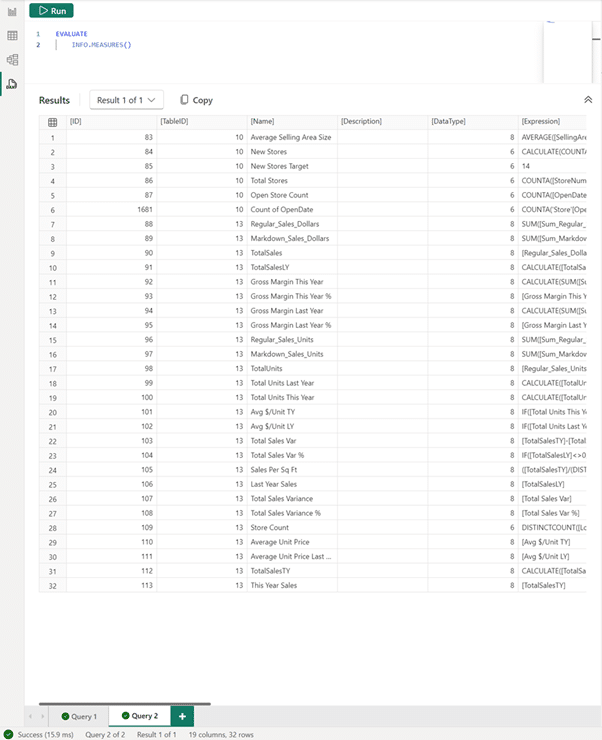
Now, all the measures in the model, their expression, and other useful information about them can be seen. The home table is also provided, though it might appear in a less useful TableID column. Thankfully, the INFO.TABLES DAX function can be used to retrieve the name of the table, with tables 10 and 13 being of interest. To join these, SELECTCOLUMNS and NATURALLEFTOUTERJOIN are used as shown in the example below.
EVALUATE
VAR _measures =
SELECTCOLUMNS(
INFO.MEASURES(),
“Measure”, [Name],
“Desc”, [Description],
“DAX formula”, [Expression],
“TableID”, [TableID]
)
VAR _tables =
SELECTCOLUMNS(
INFO.TABLES(),
“TableID”, [ID],
“Table”, [Name]
)
VAR _combined =
NATURALLEFTOUTERJOIN(_measures, _tables)
RETURN
SELECTCOLUMNS(
_combined,
“Measure”, [Measure],
“Desc”, [Desc],
“DAX Formula”, [DAX formula],
“Home Table”, [Table]
)
This DAX query can be run to see the measure, description (if available — some have been added for this example), DAX formula, and home table of all the measures in the model.
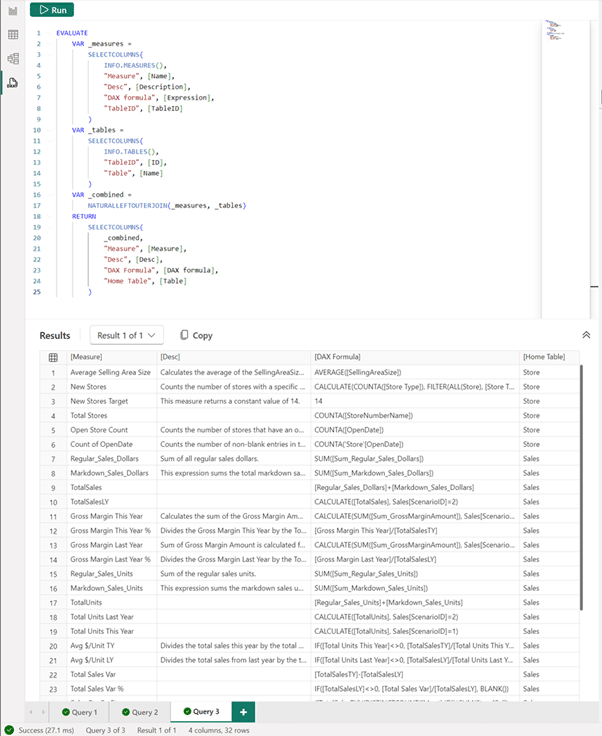
Documenting the model has been made significantly easier! The results can be copied where needed using the Copy button.
For example, you can go to Model View and choose “Enter data” to paste them into the model.
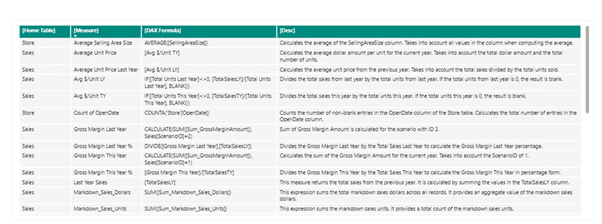
It is also possible to add a Report page, with a visual showing information about this model:
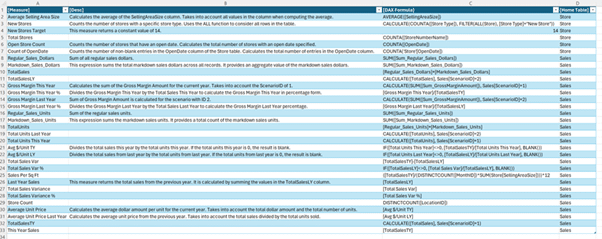
Here, the results have been pasted into Excel and a dynamic table has been created with CTRL+T.
The new INFO functions in DAX, combined with the DAX query view, represent a significant step forward in how Power BI users explore and document their data models. By enabling the extraction of metadata directly from the semantic layer, quick and reproducible access to key information is provided. This improves model comprehension and also facilitates tasks. Integrating these capabilities into the regular Power BI workflow can make a substantial difference in the efficiency and quality of the data modeling process.

